It has been yet another week of action in the crypto space. Bitcoin is facing very strong resistance at $60,000. It has tried to break the barrier a few times in the recent past, but it has always ended up receding in the top half of the $50,000’s zone. On the other hand, Ethereum, the second-biggest cryptocurrency by market capitalization managed to break the $2,000 resistance area to set a new all-time high. It briefly receded and has since been flirting with a new area of resistance around the $2,000 zone. It is safe to say BTC and ETH seem to be suffering the same fate of trying to break past their newfound areas of resistance at $60,000 and $2,000 respectively. For now, anxiety looms as traders closely watch the price action of the two biggest cryptocurrencies.
Meanwhile, traders are employing different types of methods and tools to try and predict BTC’s and ETH’s next move. One of the most favorite tools that traders use to predict the price of an asset is a technique called Technical Analysis (TA). Technical Analysis is a trading technique that assesses the price of a tradable asset by evaluating statistical trends, price movements, and trade volumes. Basically, crypto markets, like many other markets, are largely influenced by traders’ emotions. For example, when traders believe that the price of a crypto asset will go up, they will go long on that asset. Conversely, when they anticipate the opposite to happen, they will take short positions. When they are uncertain, they will wait. Technical Analysis provides a means of taking into account the psychology of the traders. If used effectively, Technical Analysis provides a mechanism to determine the best entry and exit points.
To conduct Technical Analysis, you need historical data of price and volumes, since traders’ decisions are influenced by previous market activity to a large extent. A trader needs a broad set of indicators in order to do Technical Analysis. Some of these indicators include price trends, chart patterns, trade volumes, Moving Averages (MA), support levels, resistance levels, among others.
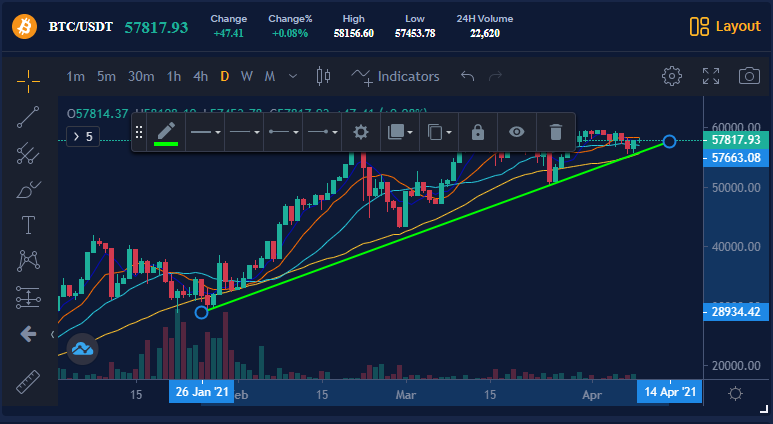
Bityard is a trading platform that aims at making trading easy. As such, it is equipped with enough tools to conduct Technical Analysis. Both on the website and on the iOS or Android application, users have access to an interface with the chart by TradingView. TradingView is a world-leading platform for Technical Analysis. It has hundreds of indicators, easy-to-use drawing tools, a customizable interface, and the ability to export snapshots. In a nutshell, the chart is fully loaded and very user-friendly.
In conclusion, Technical Analysis is a useful tool to forecast price movements. Bityard provides the tools for traders to analyze the assets and be among the early traders to catch a bullish trend or a bearish trend. However, Technical Analysis has its limitations, and it must therefore be used in combination with other techniques such as fundamental analysis. It cannot be used in isolation. It must also be noted that a lot of traders are making use of the amazing tools for Technical Analysis on the Bityard platform.
[ad_1]
Latest Crypto News[wp-rss-aggregator sources=”2165″] |
[ad_2]
Popular Links
|